¶ Dashboards
Key Note: In Planally, "projects" can mean a contract, tender, research initiative, product, audit, or any other entity defined by your workflow. The steps below apply universally, but examples here use projects for clarity.
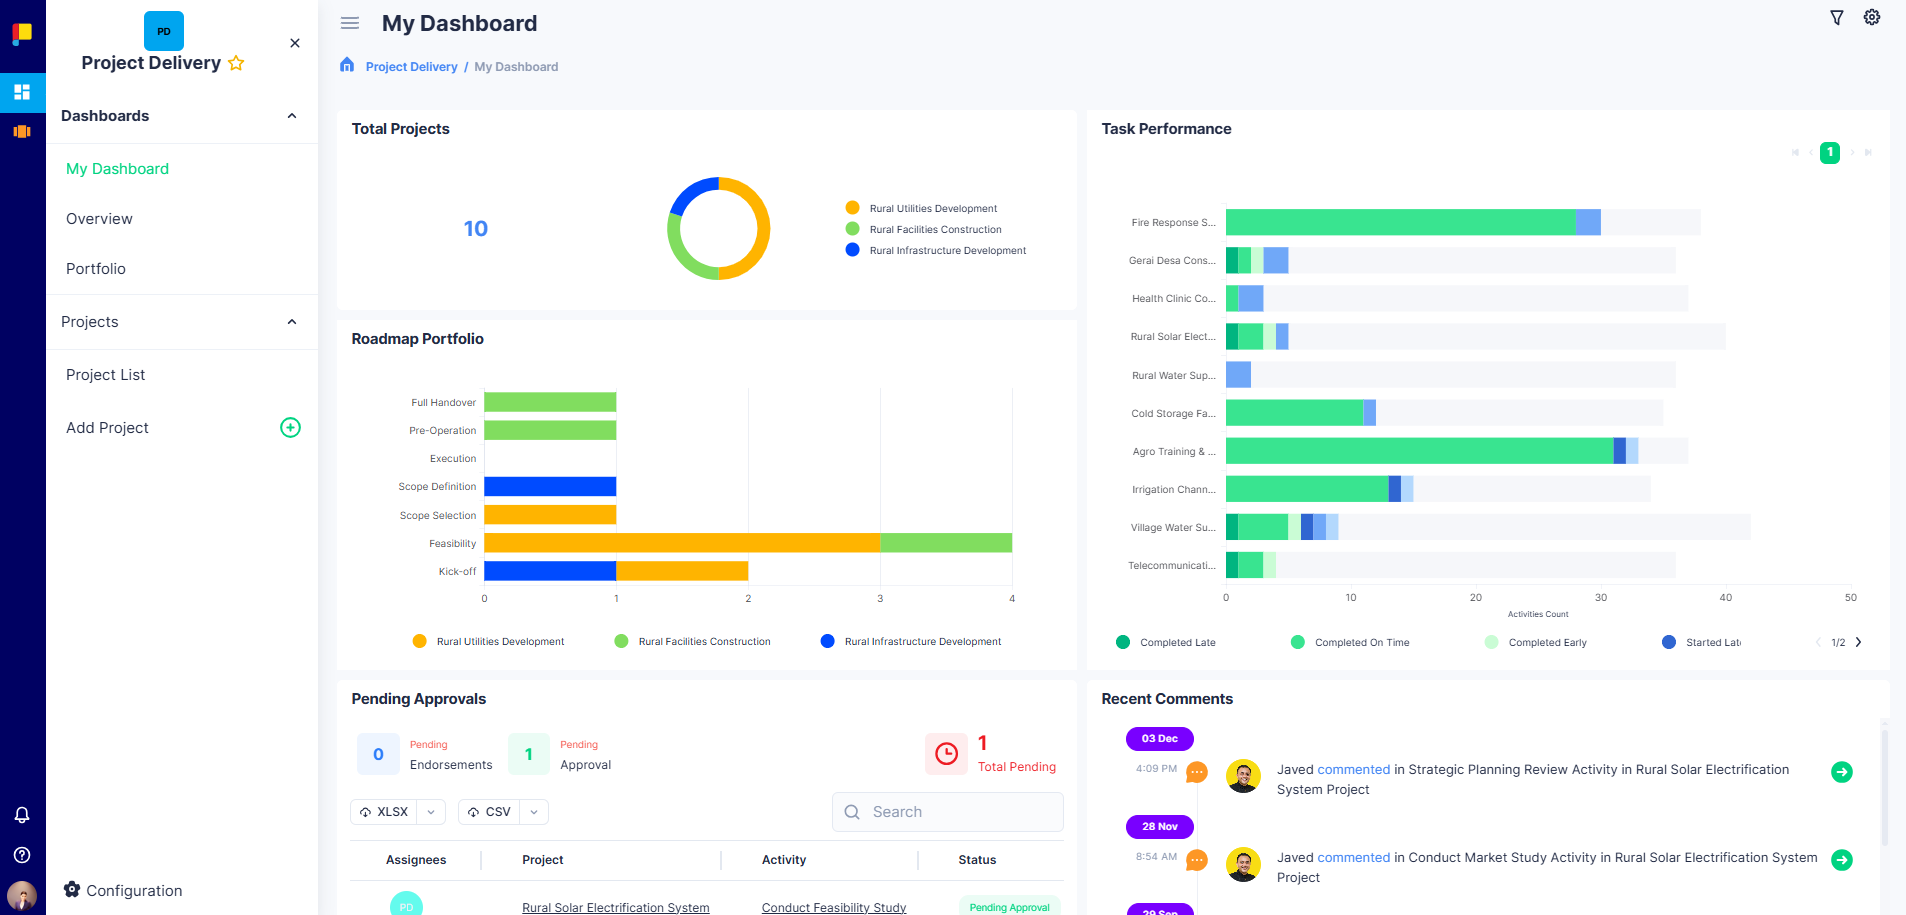
Dashboards give you real-time visibility into how execution is progressing across your workflows, projects, and activities—so you can track progress, spot risks, and act without digging through reports.
¶ Overview
Dashboards are your central hub for monitoring progress and performance across workflows. They consolidate key data into visual summaries, helping you:
- Track project and activity status at a glance.
- Identify delays and priorities instantly.
- Navigate projects without switching between multiple views or reports.
- Drill down: click a widget to open the underlying projects or activities and act on them directly.
¶ Key Features
- My Dashboard: Your projects and activity data via key widgets.
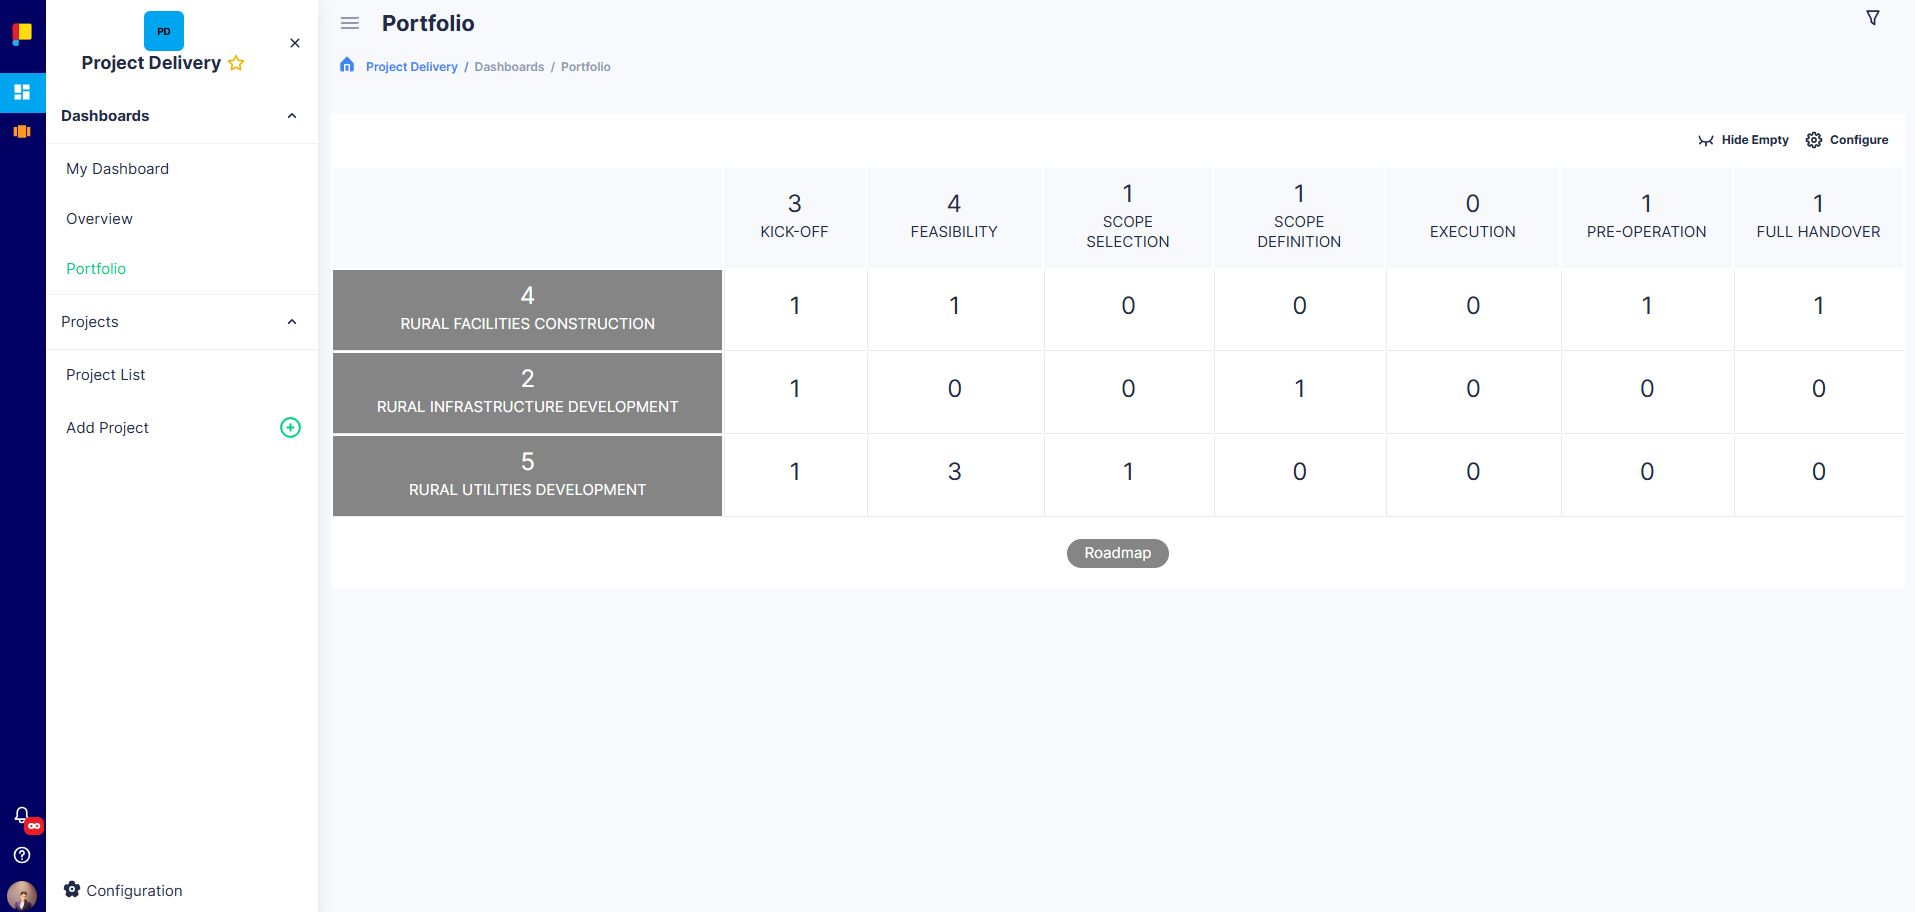
- Portfolio: High-level overview of all projects across workflow phases.
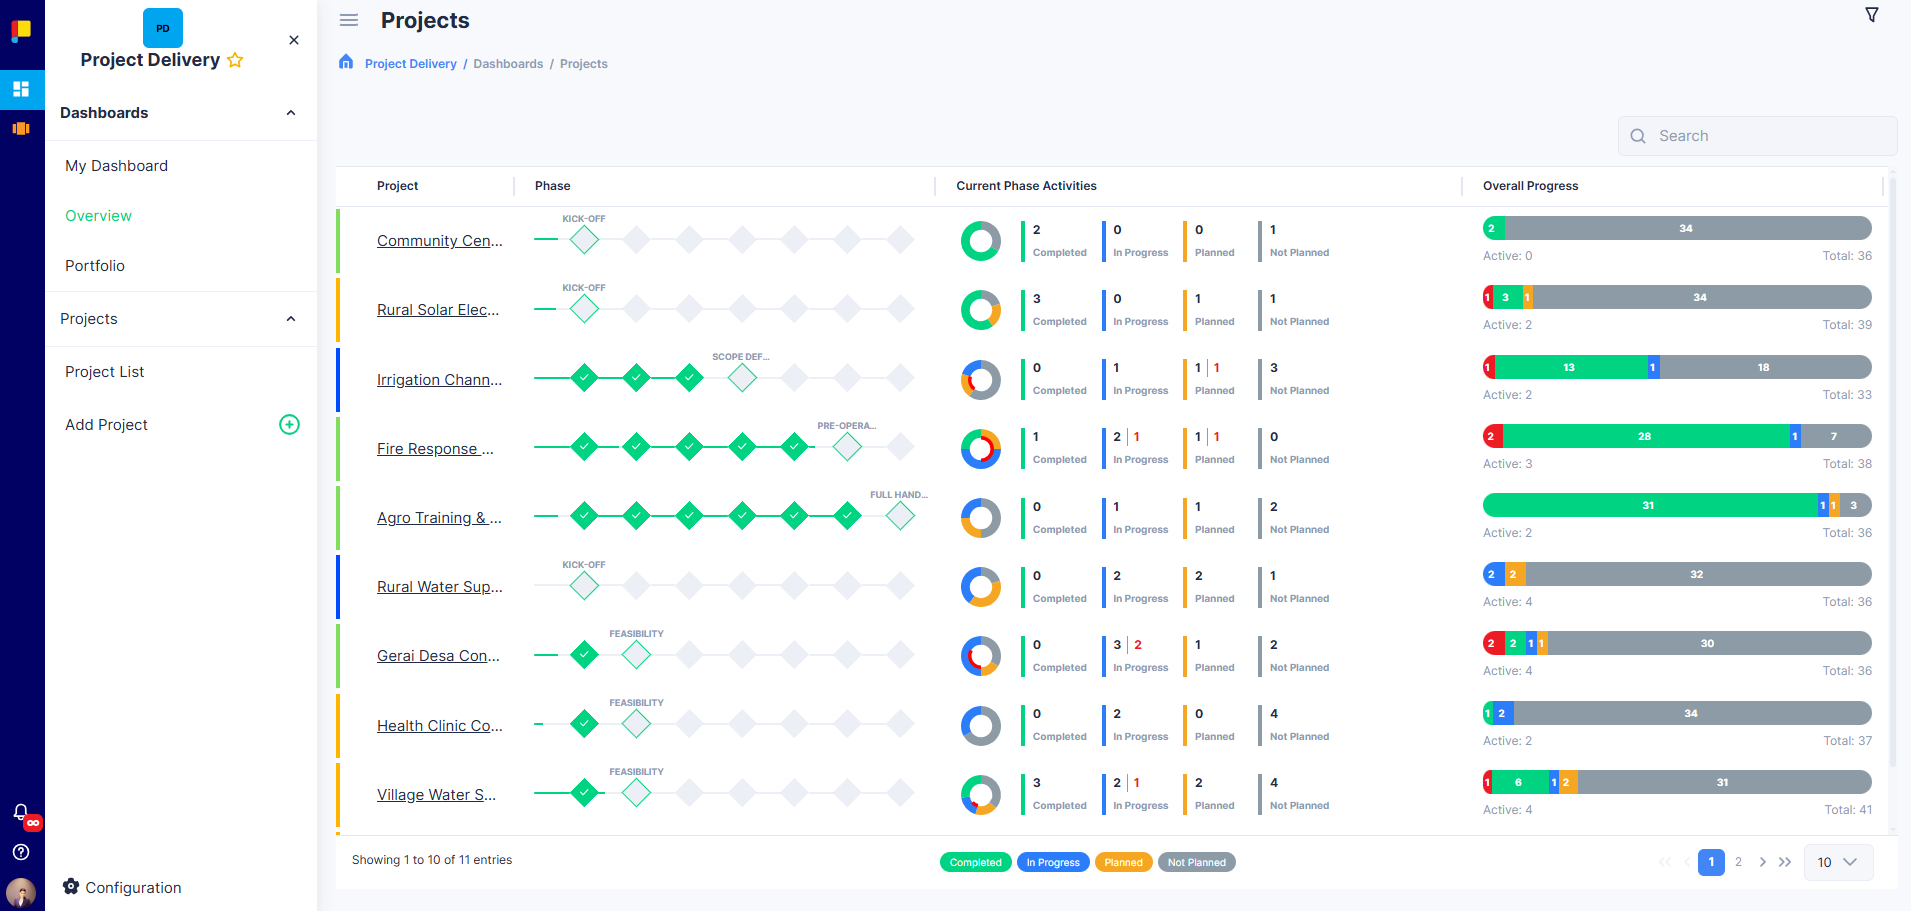
- Overview: Detailed list of projects for quick scanning and navigation.
¶ Dashboard Types
¶ 1. My Dashboard
My Dashboard summarises everything related to your work in one view. Widgets include:
- Total Projects: Number of projects you are assigned to.
- Total Activities: All activities across your projects.
- My Activities: Activities assigned to you, grouped by status (Completed, In Progress, Planned).
- Roadmap Portfolio: All projects across workflow phases.
- Burndown Chart: Workload distribution and progress trends.
- Pending Approvals: Pending endorsements and approvals for assigned activities.
- Recent Comments: Recent discussion posts across your projects.
¶ 2. Portfolio View
Portfolio View provides a high-level overview of all projects within a workflow, displayed as cards. Each card shows:
- Project Name
- Current Phase
You can filter the portfolio by attributes such as Roadmap and Area.
¶ 3. Overview
The Overview dashboard lists all projects within a workflow in a table format, including:
- Project Name
- Roadmap
- Phase
- Current Phase Activities
- Overall Progress
This view is ideal for quick scanning, operational reviews, and bulk project management.
¶ Best Practices
- Use My Dashboard daily to track your tasks and deadlines.
- Use Portfolio View to understand the distribution of projects across phases and roadmaps.
- Use Overview for quick navigation and operational reviews.
¶ Drilling Into Your Data
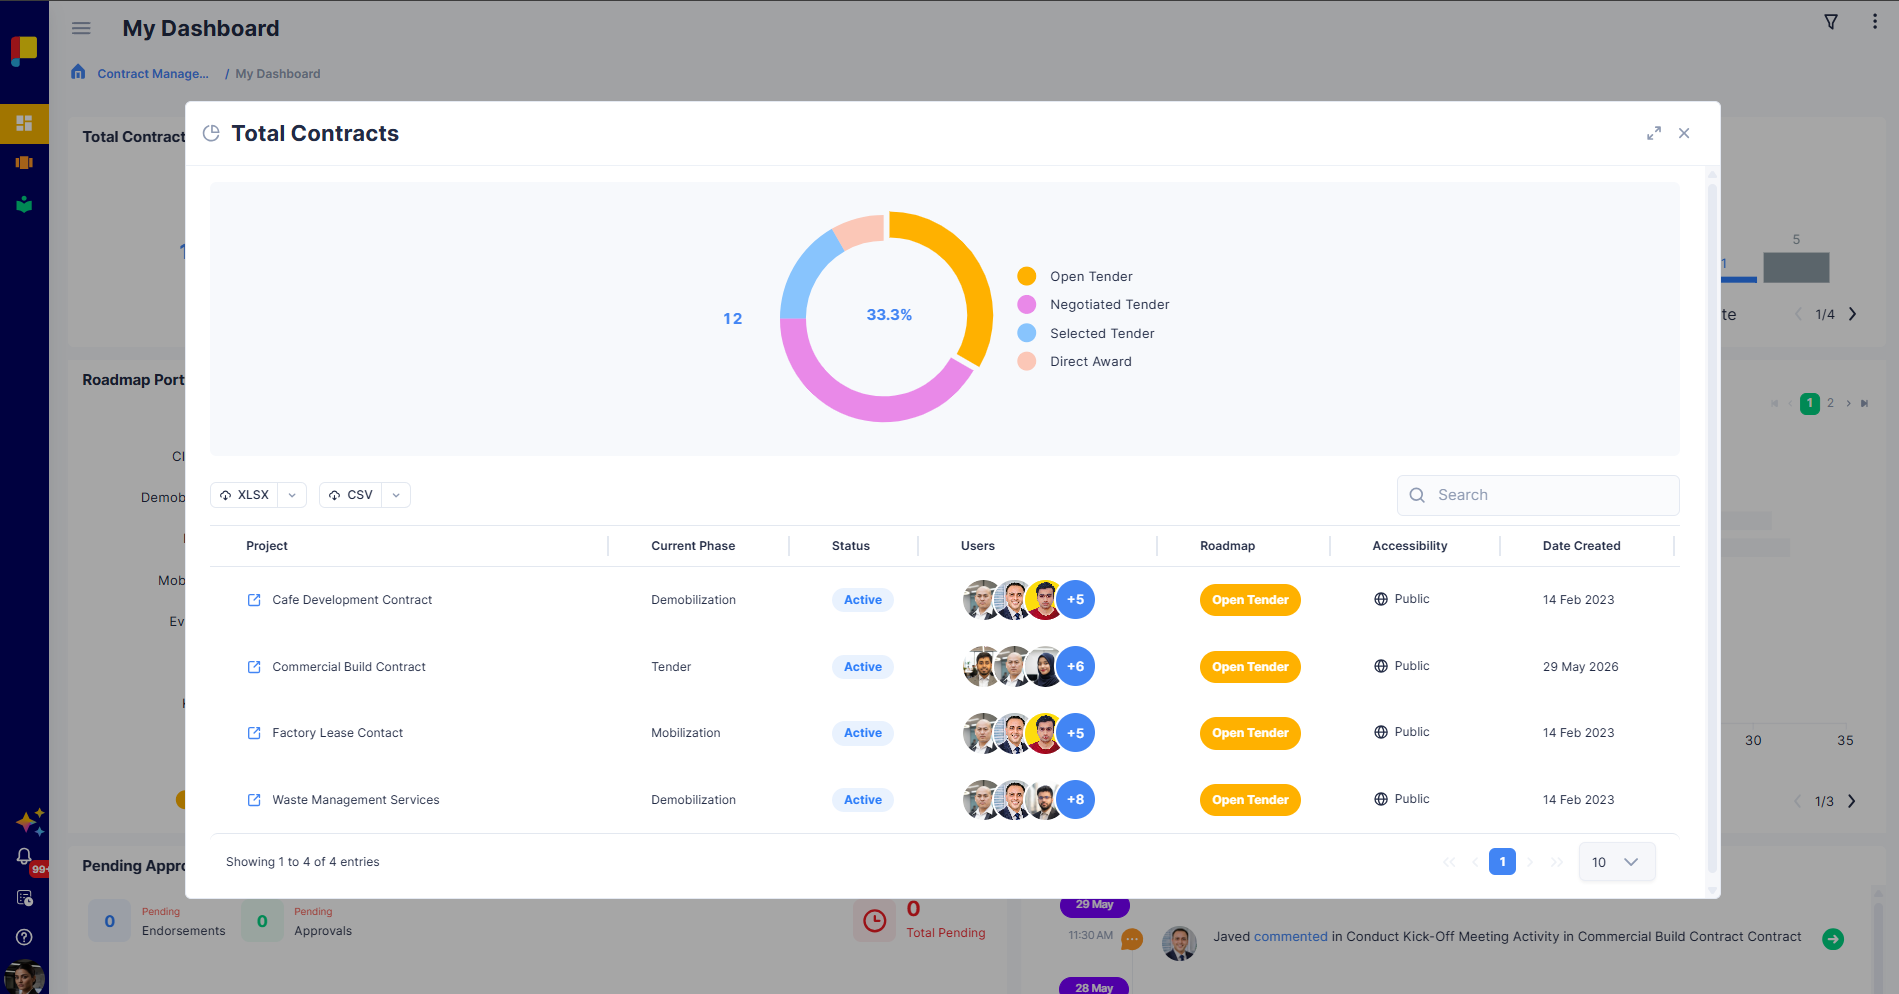
Dashboards are interactive. Click a widget—such as a status segment, a project card, or a metric—to open the underlying list of projects or activities, then open any item to view or update it. This lets you move from a high-level view straight to the work that needs attention.
Admins: dashboards can be created and configured for your workflow, including new widget types. See Building Dashboards.